

HESYS SLOPE / WORKED EXAMPLE GUIDE
Understand the slope.
Explore what changes.
Follow a slope stability assessment from ground profile and soil strength to groundwater scenarios, slip surfaces and engineering interpretation. These worked examples show the current HESYS Slope analysis workflow.
Development analysis workflow · 2D limit equilibrium · Browser application not yet available
01 / START HERE
From ground model
to a clear result.
Keep the geometry, material assumptions and water conditions alongside every result. Search the whole slope and individual faces, then compare the mechanisms that govern.
- Define the sectionRecord crest and toe levels, benches, material boundaries and loads with their setbacks.
- Set the scenariosChoose strength parameters and water profiles. Keep the baseline separate from sensitivity cases.
- Review the mechanismsInspect the slip surface, factor of safety and force checks. Record the governing assumptions and follow-up actions.
02 / MODEL INPUTS
Make the assumptions
visible.
The illustrated section has three 1 m faces separated by benches. Its upper material is modelled with effective-stress strength; the underlying clay uses undrained strength. These are example inputs, not recommended values for another site.
| Input | Worked example | What to record |
|---|---|---|
| Geometry | 3 m overall depth; benched profile | Section coordinates, boundaries and the construction stage |
| Upper material | c′ = 5 kPa; φ′ = 28°; γ = 19 kN/m³ | Strength basis and whether apparent cohesion can be relied on |
| Underlying clay | cᵤ = 40 kPa; φᵤ = 0°; γ = 20 kN/m³ | Undrained strength evidence and relevant variability |
| Surcharge | 20 kPa, starting 1.5 m behind the crest | Load magnitude, extent and setback |
| Groundwater | Prescribed water profiles; no suction strength | Observed or assumed water levels and sensitivity cases |
The current examples use prescribed pore pressures. They do not show a calculated seepage-flow solution.
03 / OVERALL STABILITY
Look beneath
the whole slope.
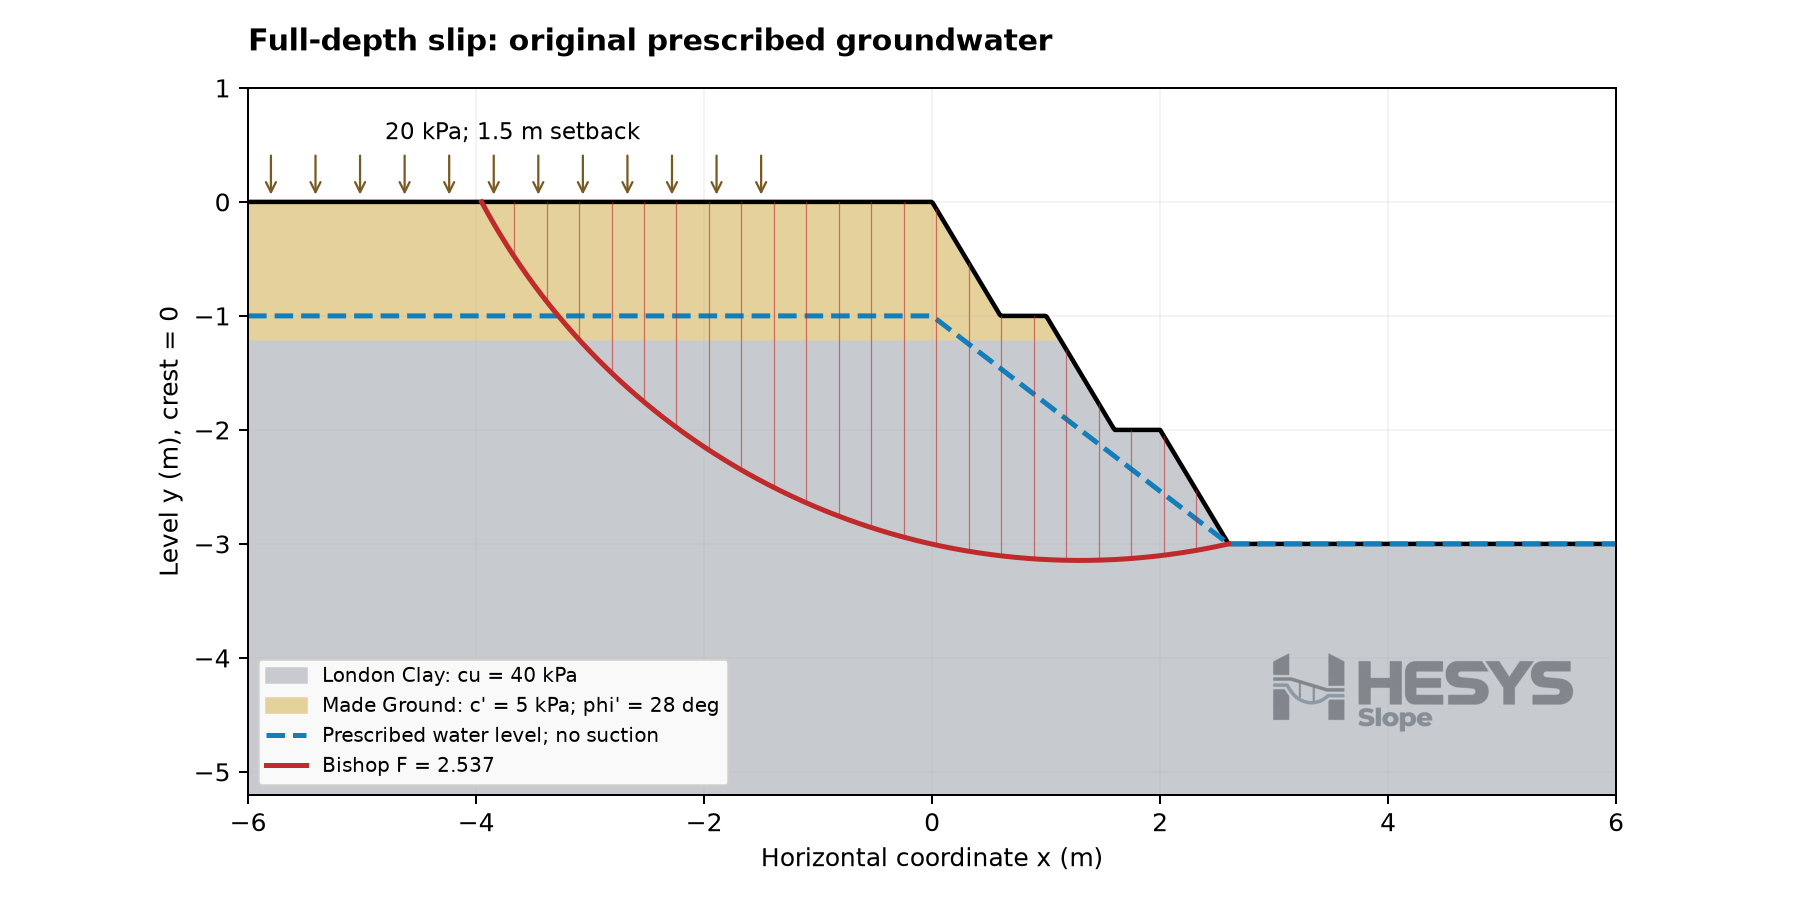
The red arc shows a full-depth circular slip surface. Vertical lines divide the sliding mass into slices. The blue dashed line is the prescribed groundwater profile.
The plotted surface gives a Bishop Simplified factor of safety of 2.537. This value describes this surface and set of assumptions; local faces need their own checks.
04 / WATER CONDITIONS
Test a higher
water level.
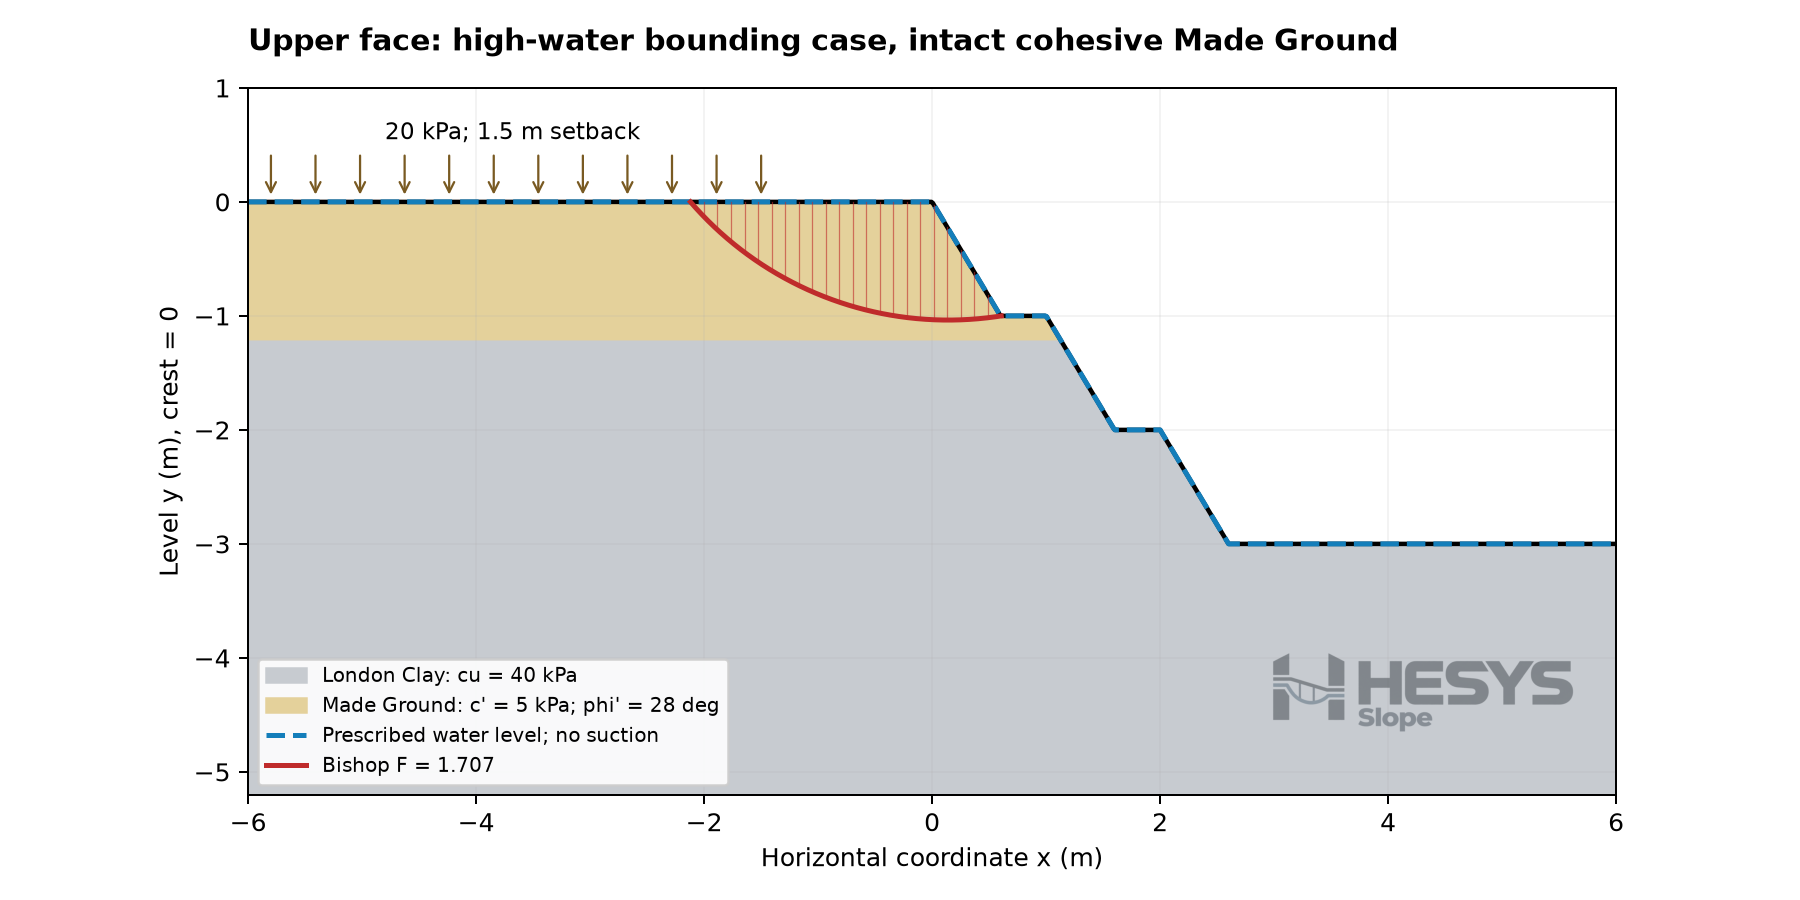
This bounding case places the prescribed water level at the ground surface and examines an upper-face mechanism. The plotted Bishop result is 1.707, retaining the assumed cohesion in the upper material.
Both the water condition and the slip mechanism differ from the preceding figure. The two values are not a like-for-like measure of the effect of water alone.
05 / LOCAL MECHANISMS
A shallow feature
can govern.
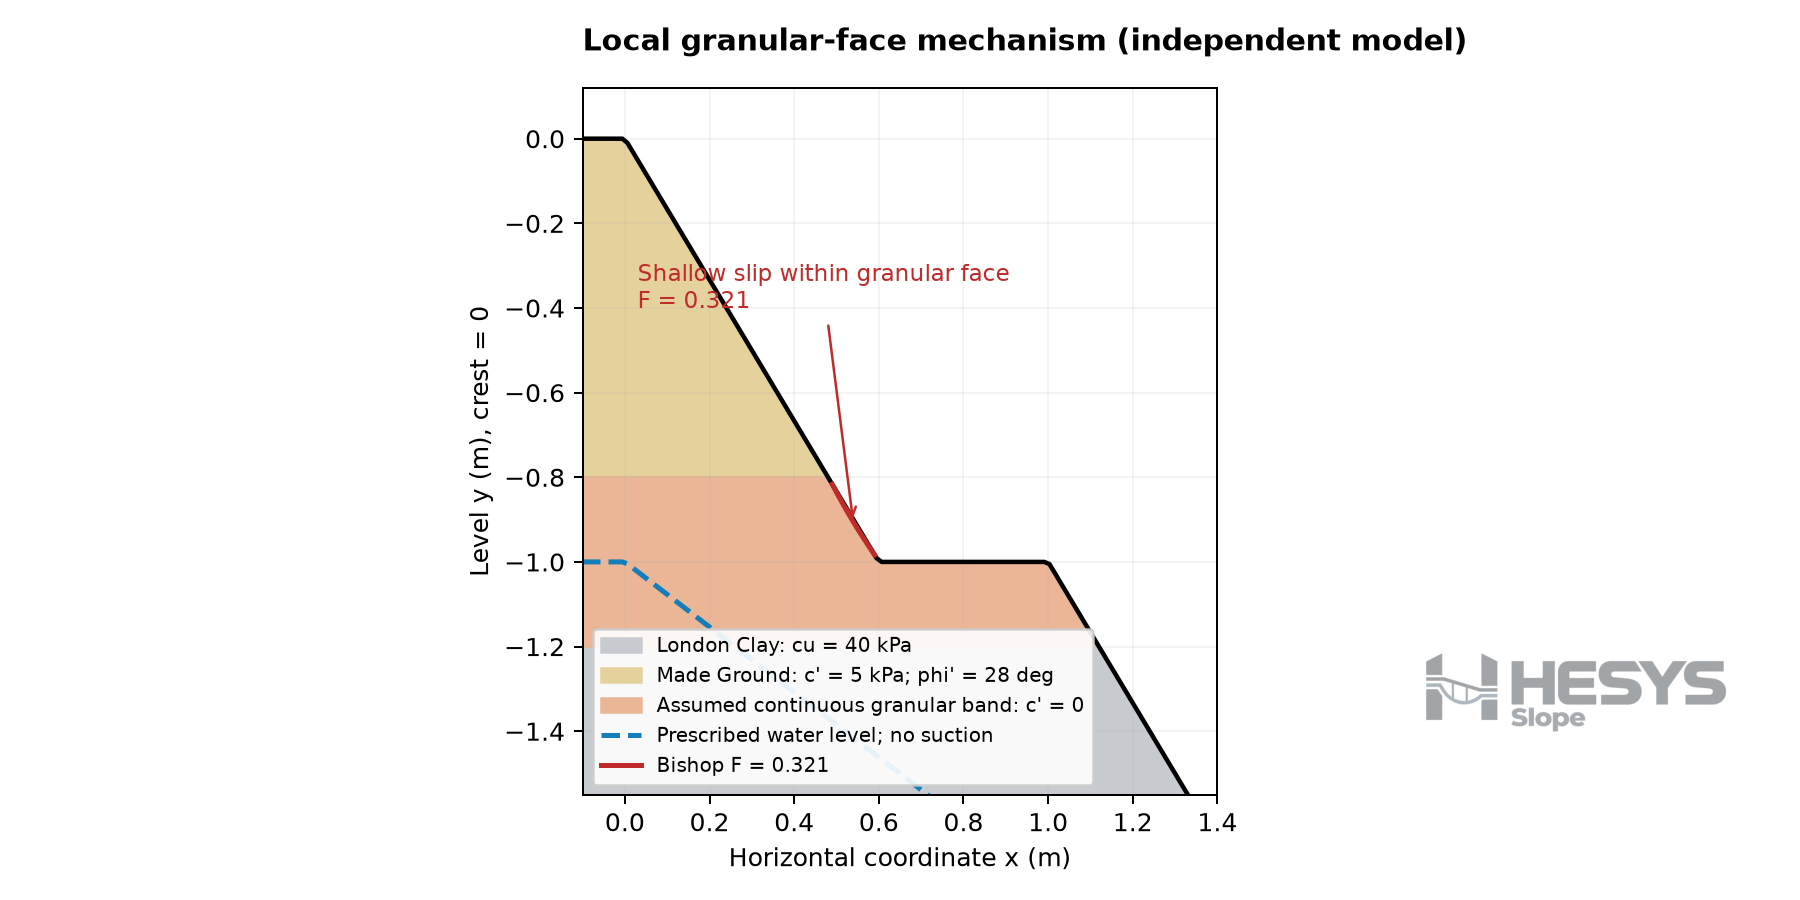
A separate sensitivity case introduces an assumed continuous granular band with zero cohesion. The shallow mechanism gives F = 0.321, showing why an overall slip check alone does not describe every possible mechanism.
The band is a model assumption for this example, not a confirmed ground feature.
Include a
water-filled crack.
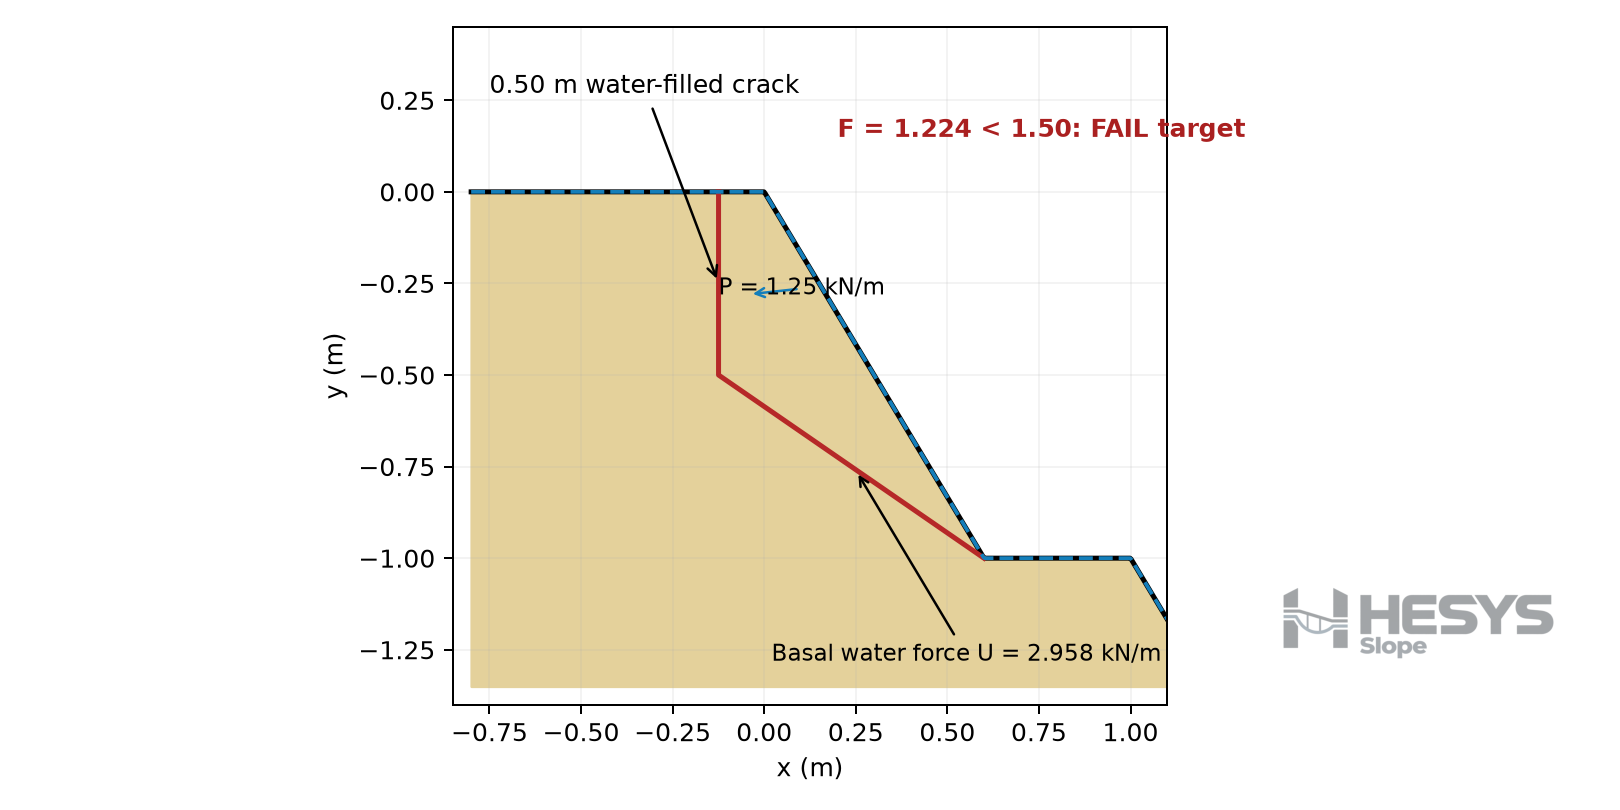
The separate wedge example introduces a 0.50 m water-filled crack, with water thrust on the crack and uplift along the base. It gives F = 1.224, below the example target of 1.50.
The 1.50 target belongs to this example. The appropriate acceptance criteria and factoring basis must be established for each assessment.
06 / READ THE OUTPUT
Keep the result
with its context.
The current workflow produces section plots, scenario results and slice data. The supporting checks use Bishop Simplified, Ordinary/Fellenius comparisons and selected Spencer evaluations or searches. The displayed circular plots are labelled with their Bishop results.
- Identify the caseKeep method, water profile, strength parameters, loading and search region with each reported value.
- Check the solutionReview convergence, slice sensitivity and force validity. Flag tensile base forces and near-singular solutions rather than treating them as accepted results.
- Compare the casesSeparate overall and local mechanisms, assumptions and observations. Record what controls the result and what evidence remains needed.
HESYS SLOPE
Discuss your
slope assessment.
Talk through the ground model, water conditions and mechanisms your team needs to assess.